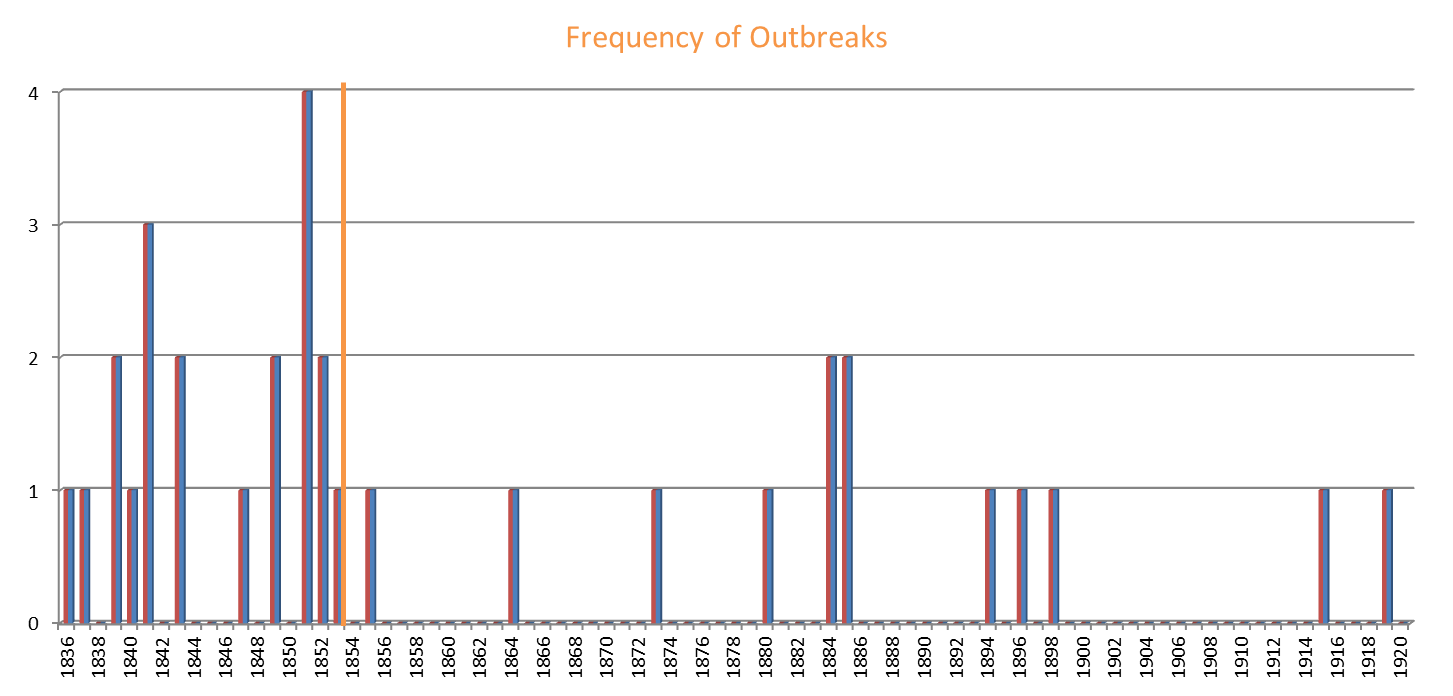
Frequency distribution of the outbreaks – depicting the sharp drop in frequency after Tangal’s deportation in 1852 (indicated by orange line) by Avinash|Published January 9, 2016-at dimensions 1453 × 696 in Teaching Multiperspectivity Through A Study of Moplah Rebellion Images navigation Previous Next Frequency distribution of the outbreaks – depicting the sharp drop in frequency after Tangal’s deportation in 1852 (indicated by orange line) Frequency distribution of the outbreaks – depicting the sharp drop in frequency after Tangal’s deportation in 1852 (indicated by orange line)Share this:FacebookTwitterMorePinterestLinkedInTumblrRedditEmailPrintLike this:Like Loading...